WHM 11 services series
8. How to view the Apache Status page in WHM
The Apache Status page in WHM contains several useful bits of information about your system's web server.
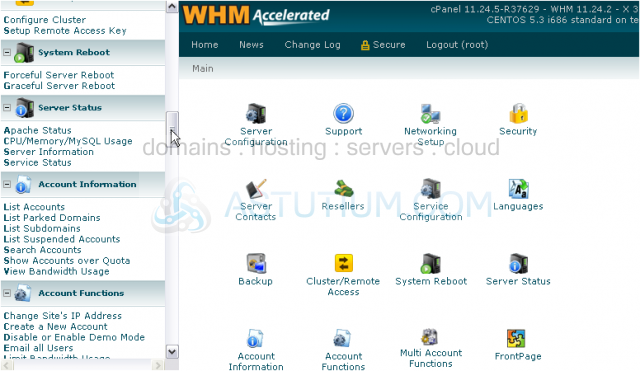
1) It can be found in the Server Status category of the menu.
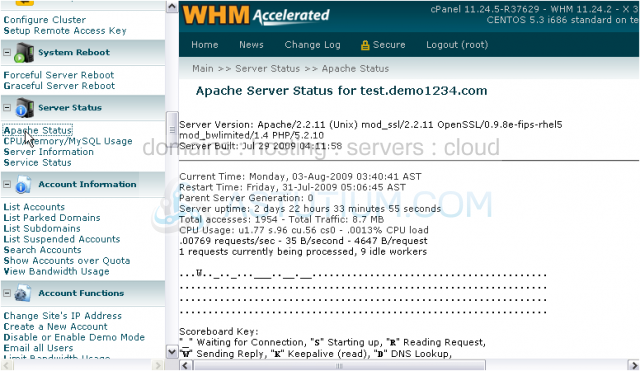
At the top of the server status page, you'll see some basic information about Apache, including its version number, the modules that are active, and when the server was last built. After the horizontal rule, you'll see the current time, when the server was last restarted, and the server's uptime. Below that is an assortment of statistics about Apache.
This diagram represents how many Apache processes are currently running. As you can see, our server is currently sending a reply to one request, while 9 Apache processes are standing by in idle, waiting for connections to be made.
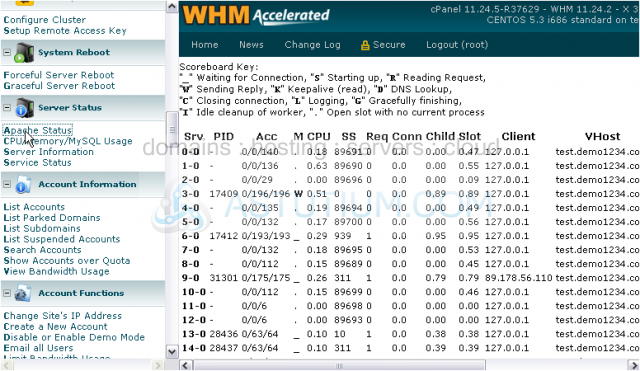
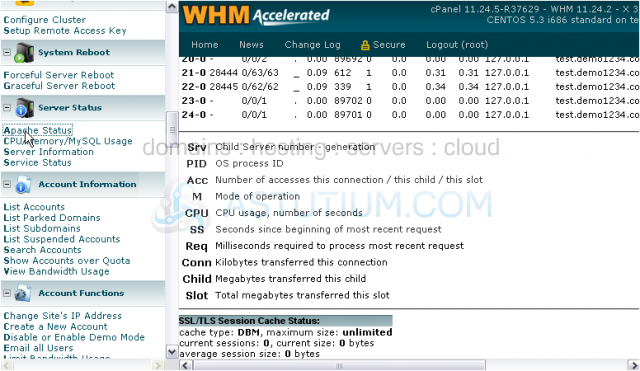
A key for this diagram is shown below. This key also applies to the table below. In our case, the table lists 25 rows, each one representing a slot that can contain an Apache process. New Apache processes will be launched, as needed.
When a slot contains a process, its Process ID will be listed in the PID column. If a visitor is connected to a process, their IP address will show up under Client.
You can also see to which virtual host the client is connected in the VHost column, and which URL they're visiting in the Request column.
This is the end of the tutorial. You now know a little bit about the Apache Status page in WHM.